Overview

In 2021, Eunomia Research & Consulting and the Ball Corporation released the inaugural edition of the 50 States of Recycling Report, a first-of-its-kind state-by-state comparable assessment of common packaging materials based on 2018 data. This calculation set a baseline in each state that can be used to inform policy, design programs, and assess infrastructure needs.

The 50 States of Recycling 2.0 Provides:
  • Updated data and rankings of state recycling rates by material type
  • Analysis of the economic, social, and environmental impacts of both current recycling rates and possible optimal recycling rates
  • Models the potential impact of recycling policies including:
    • Modernized Recycling Refunds (also known as Deposit Return Systems or Bottle Bills) in the Northeast
    • Performance of Extended Producer Responsibility (EPR) policy only vs. EPR +Recycling Refunds (RR) in two states- Washington and Colorado.

We hope this data and analysis will help equip policymakers and industry partners with the information needed to maximize economic, social, and environmental outcomes.

To learn more, read the press release.

Key Findings

Today only 24% of U.S. waste is actually recycled, and only 15% is recycled in a closed loop, but we can and must do better. Based on the report findings, we know:

On average, recycling rates across states have stagnated and some of the largest shifts between 2018 and 2021 are the result of the inclusion of new and more accurate data released since 2018. This shows the need for continued action to improve U.S. recycling systems.

Collection and Recycling are not synonymous

Collection and recycling are not synonymous.

We must measure real recycling and prioritize the recycling of high value materials instead of collecting non-recyclable contaminants that make the entire system less effective. 

Closed Loop Recycling Icon

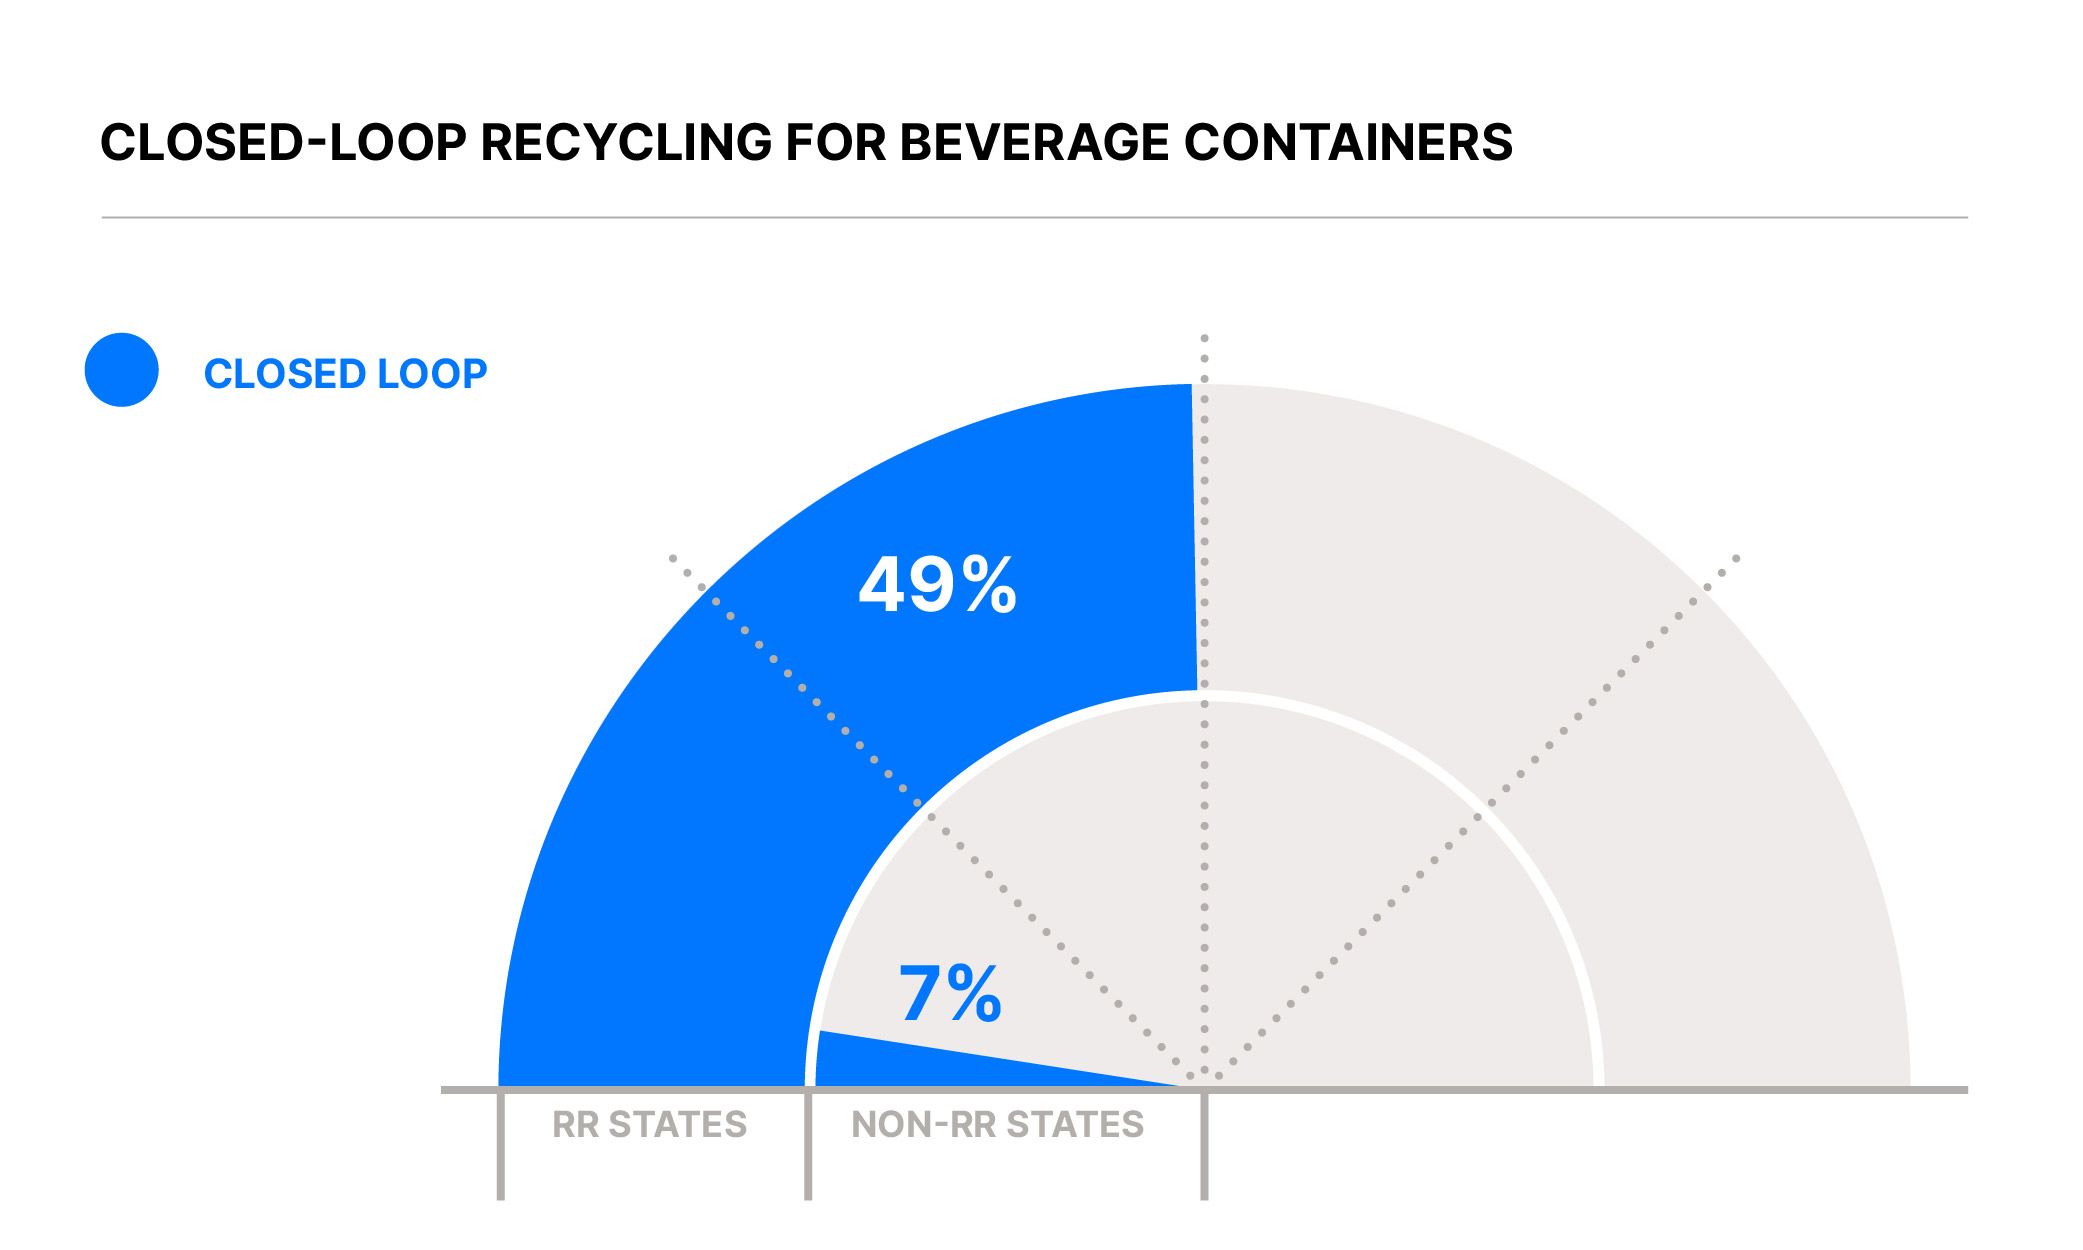
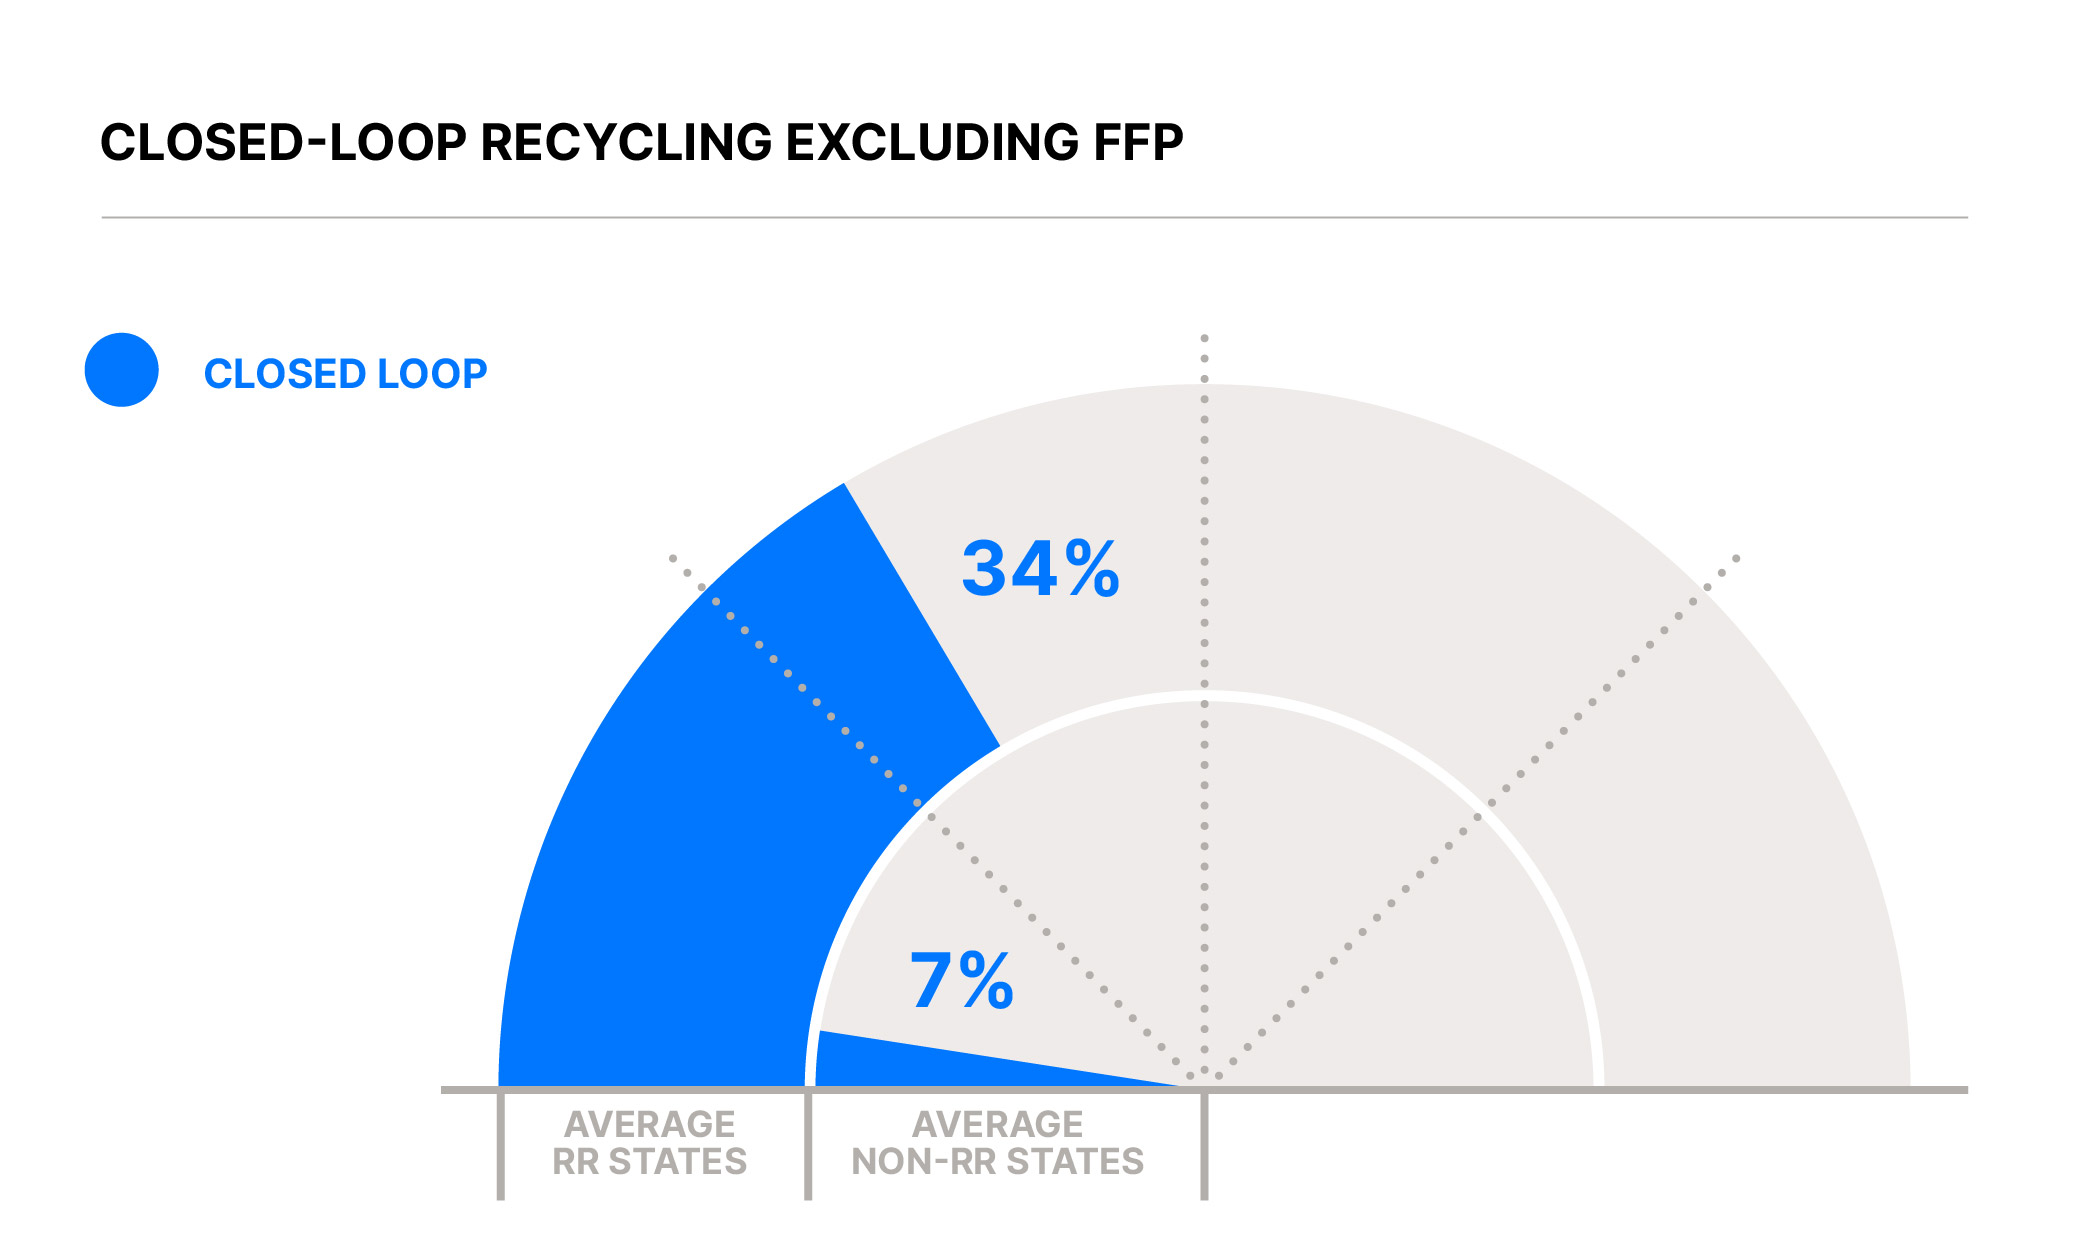
Closed loop recycling maximizes recycling benefits. States with Recycling Refunds (RR) have significantly higher closed loop recycling rates than non-RR States.

We must prioritize the closed loop recycling. Keeping materials in use for as long as possible maximizes social, environmental, and economic benefits. RR states recycle 34% of material packaging through closed loop end markets compared to 7% for non-RR states.

Increasing Recycling Rates can support climate change

Increasing recycling rates can support the fight against climate change and unlock economic potential.

Recycling results in the avoidance of over 79 million MTCO2e in the US annually. U.S. recycling industry only captures about 32% of the total value of material in the packaging waste stream. 

EPR and RR will accelerate higher recycling rates

Together EPR & RR Achieve the Highest Recycling Rates.

When implemented together well-designed Extended Producer Responsibility (EPR) and Recycling Refunds* (RR) will accelerate the implementation and the ability to achieve higher recycling rates within a shorter period. Policymakers at the state and federal level must prioritize enacting well-design EPR +RR recycling policy and legislation together to deliver the best social, environmental, and economic outcomes. 

As legislators and business leaders seek to increase recycling rates and boost the environmental, economic and social impact of recycling across the United States, well-designed policy will be required. The two policies that can drive up recycling rates, support closed loop recycling and maximize supply to domestic markets are Recycling Refunds for beverage containers and Extended Producer Responsibility for packaging and paper products.


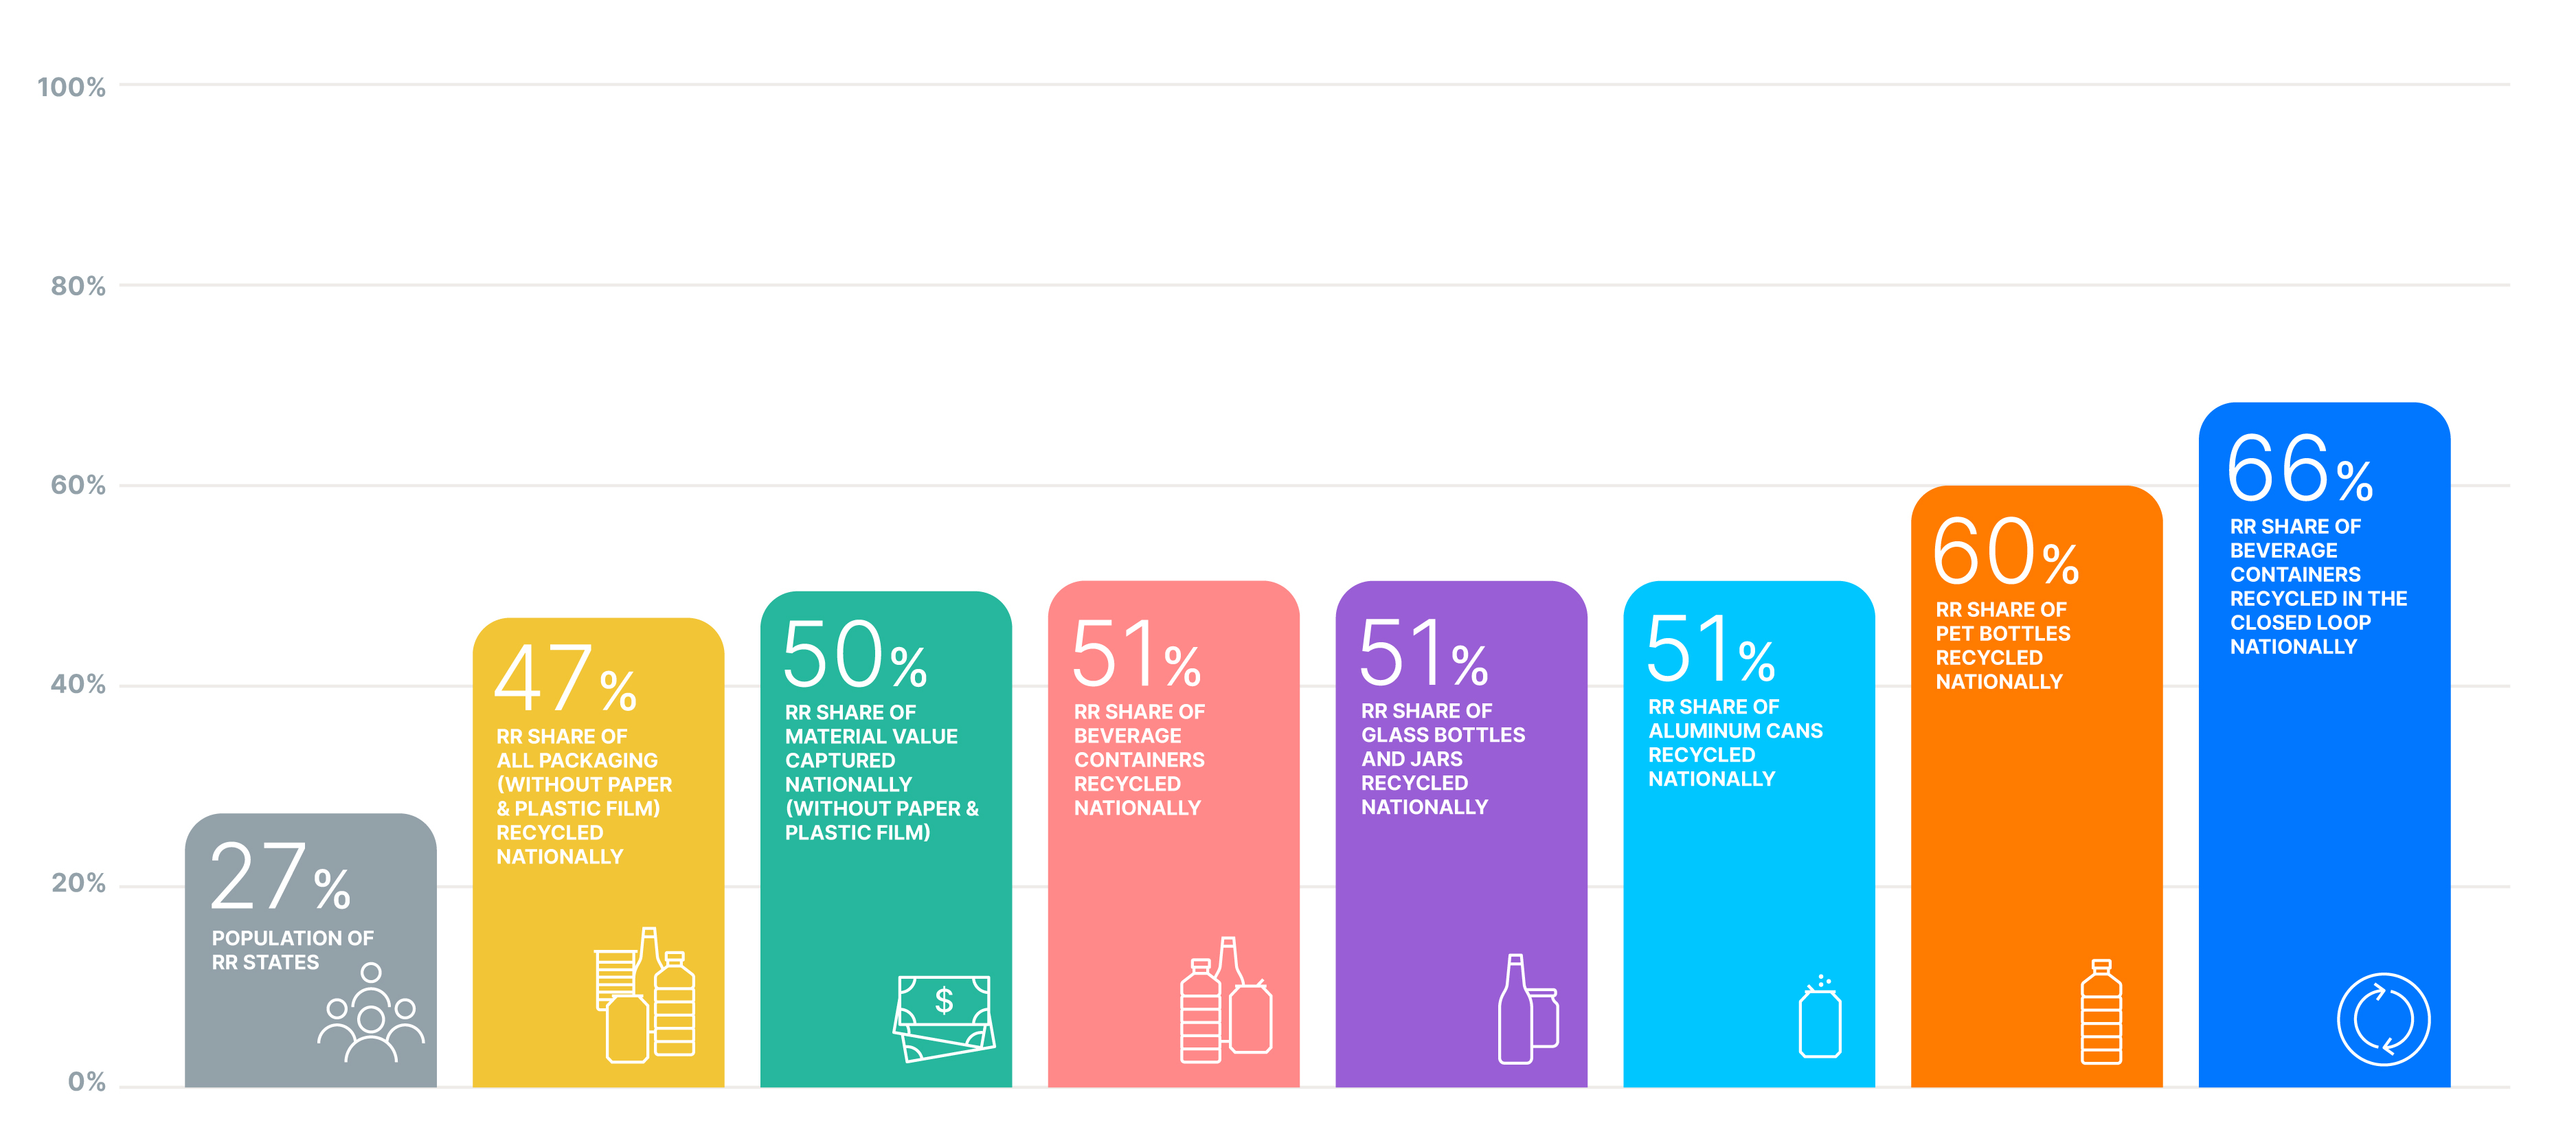
The 10 States with Recycling Refunds Represent...
Closed Loop Recycling Diagram


CLOSED LOOP RECYCLING RATES

A closed loop system enables materials to not only be collected and repurposed once but channeled back into systems multiple times.

Currently less than 20% of all packaging (not including FFP) generated in the U.S. is of sufficient quality to be recycled through closed loop processes.

RR states recycle more material in a closed loop than non-RR states.


  • Closed Loop Recycling Diagram
  • Closed Loop Recycling Diagram

ENVIRONMENTAL & ECONOMIC BENEFITS OF RECYCLING

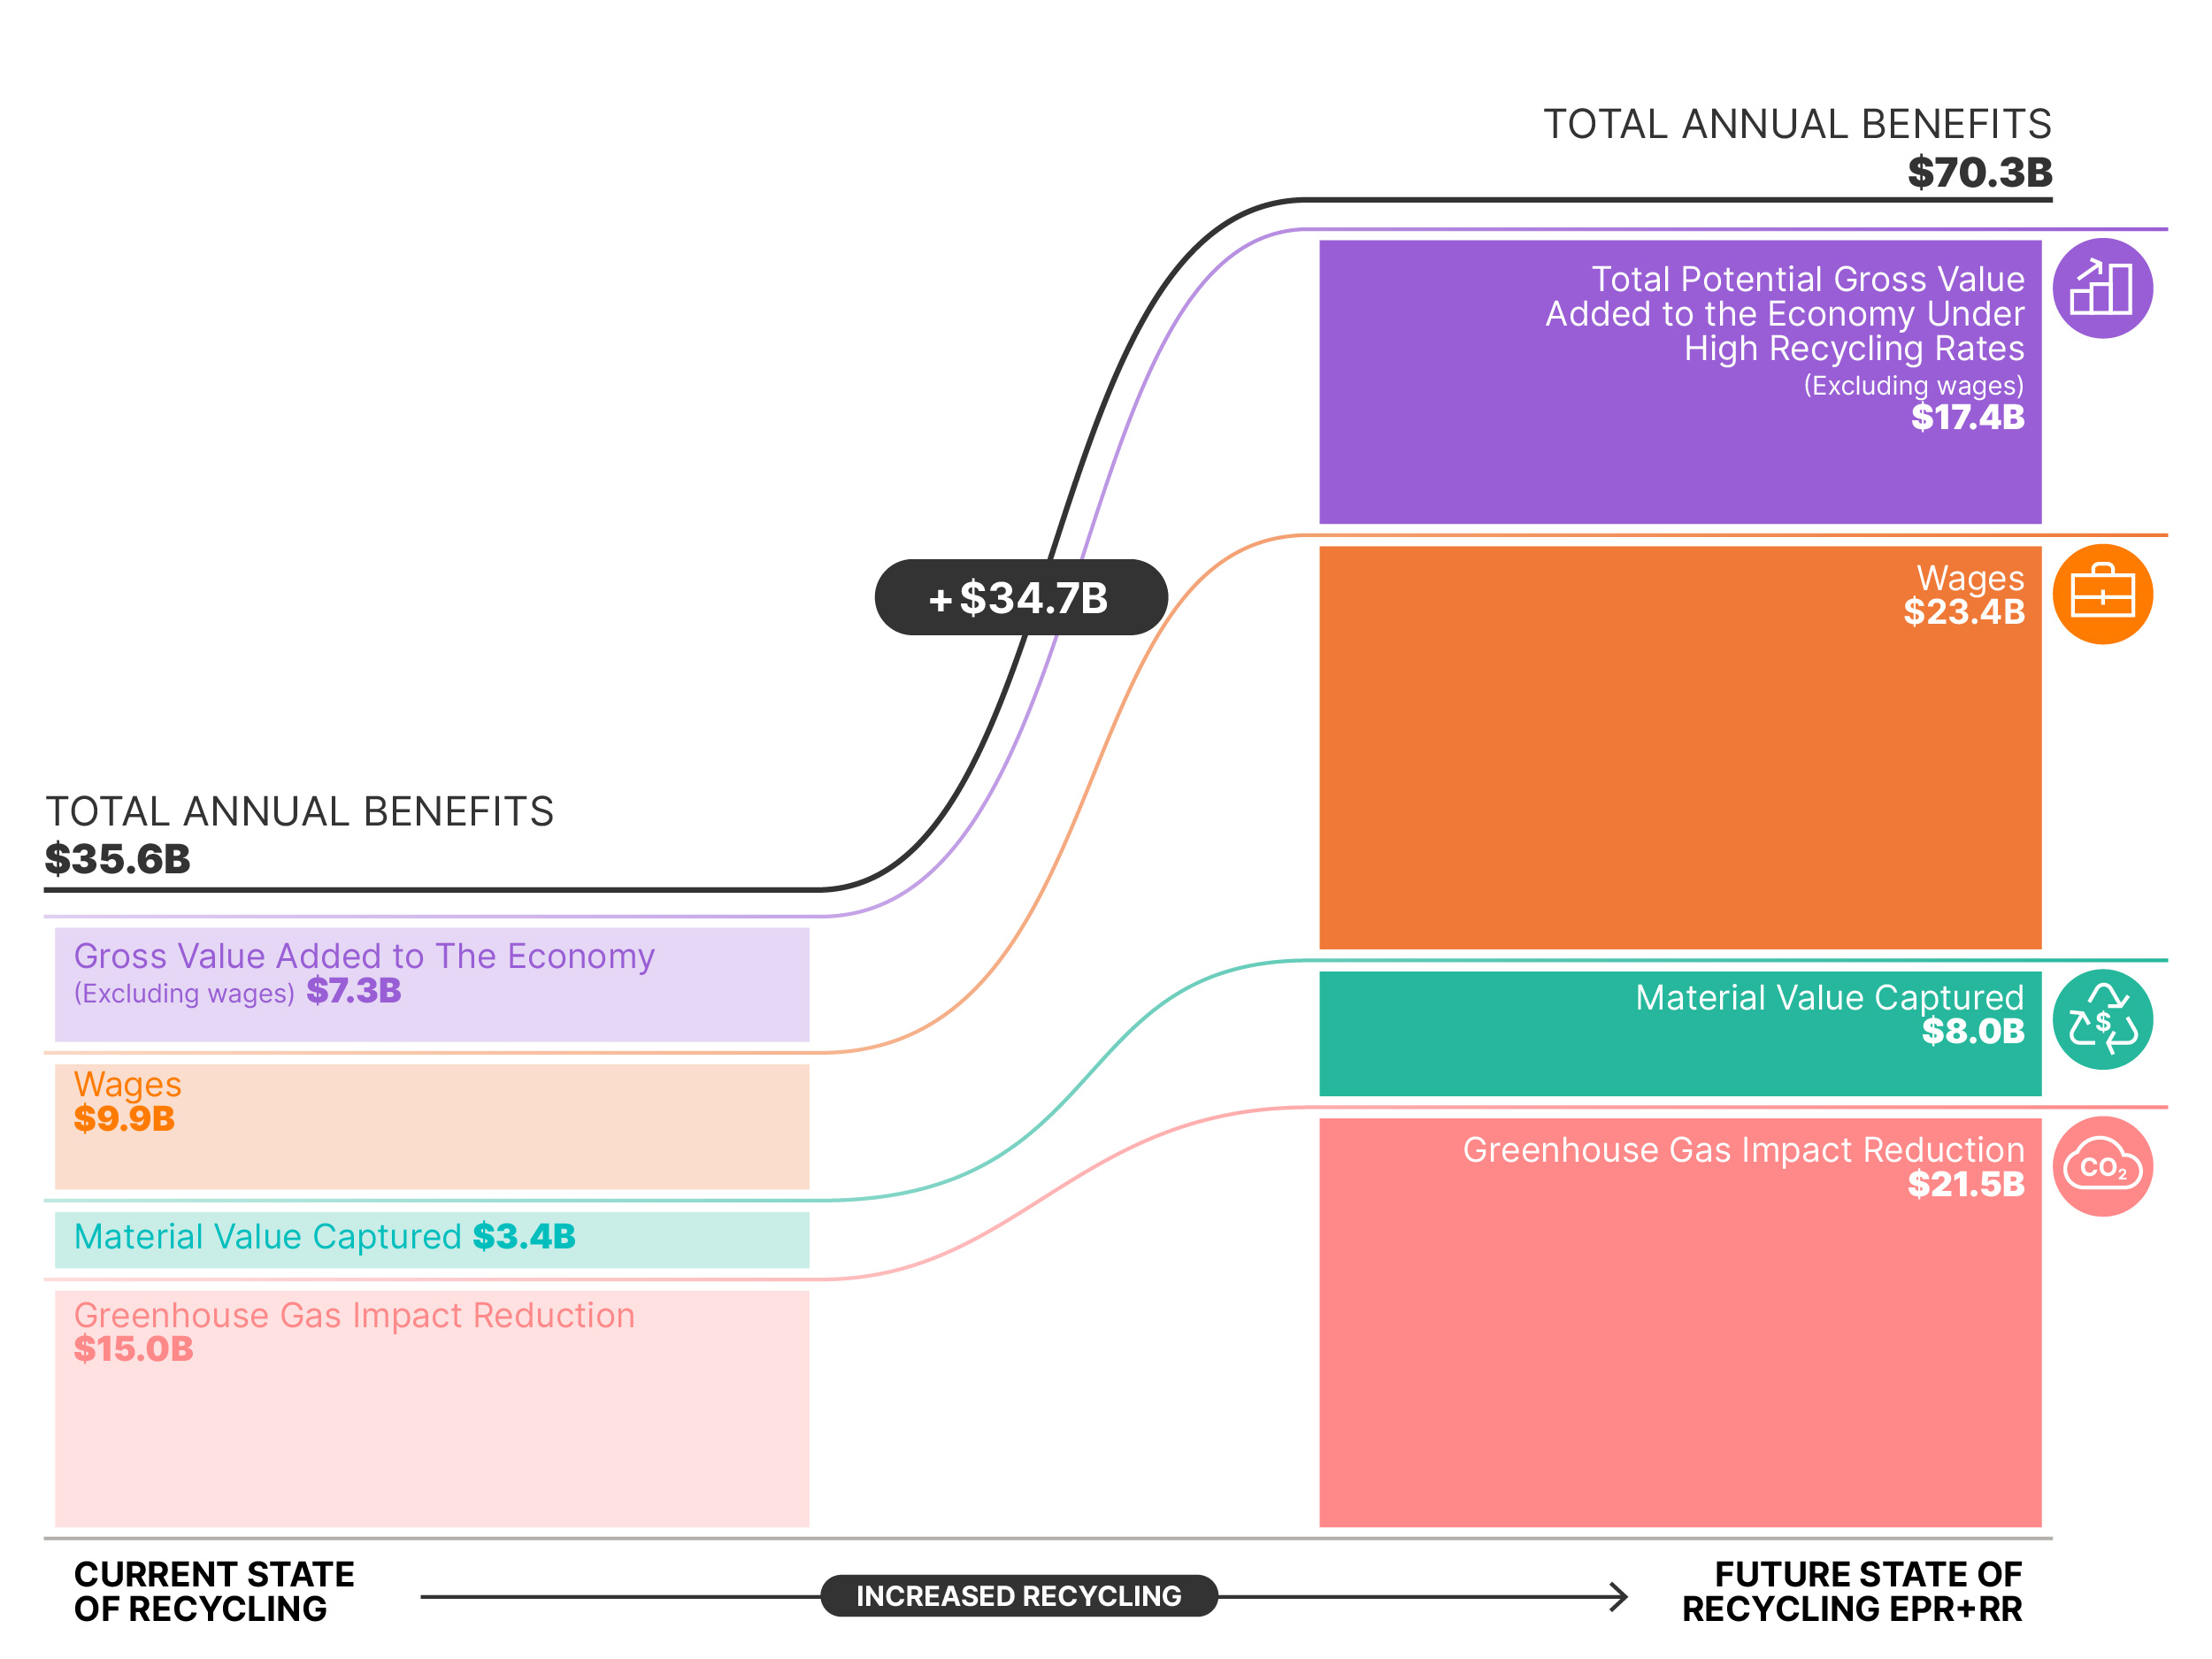
When expressed as a monetary benefit, the total environmental and economic value of recycling in the U.S. is approximately $35 billion, accounting for gross value, employment income from recycling-related jobs and greenhouse gas impact reduction – comparable to removing more than 17 million vehicles from the roads. If effective recycling policies were enacted nationwide, such as pairing Extended Producer Policy alongside Recycling Refunds, the benefit of recycling would double to $70 billion. 
Current State of Recycling vs Future State of Recycling

At Keep America Beautiful we are committed to working with partners across the country to reduce litter and improve recycling on a path to more resilient communities and a more beautiful America. The updated 50 States report offers valuable research data to improve decision making for stakeholders as we all seek high impact and efficient solutions to reduce waste, improve water quality and accelerate reuse of important natural resources. We applaud the sponsors of the 50 States Recycling report and look forward to collaborating to share this research as we seek to advance new approaches to addressing today’s litter and materials recovery challenges.
- Jenny Lawson, President and CEO of Keep America Beautiful
Data is a key ingredient for understanding where our recycling system is today, and where we need to go,” said Keefe Harrison, CEO of The Recycling Partnership. “This report shows that U.S. recycling is performing well below its potential, but smart policy and investment can unlock the tremendous environmental and economic benefits that come from recycling.
- Keefe Harrison, CEO of The Recycling Partnership
Many consumers want to, and think they are, doing the right thing when they put their can or bottle in the recycle bin. However, collection does not equal real recycling. Creating a true closed loop system — where a can becomes a can, or a bottle becomes a bottle — will require a well-designed recycling policy that creates compelling incentives to recycle and expand recycling infrastructure and systems to ensure the process is simple, convenient and affordable for everyone.
- Daniel W. Fisher, Chairman & CEO of Ball Corporation
We have more work to do to pass the WRAP Act, comprehensive legislation that establishes a system where EPR and Recycling Refunds work together. This report shows that if Washington implemented both an EPR and a Recycling Refund program we could keep millions of tons of material out of landfills, create over 8,000 jobs and reduce over half-a-million tons of greenhouse gas emissions in our state alone. Additionally, we know that states with Recycling Refunds see up to an 84% reduction in littered beverage packaging. Consumers are incentivized to return their own used containers and to pick up ones that are in the environment. Trash becomes treasure, and that’s a win-win for everyone.
- Joe Fitzgibbon, Washington State Representative
The recycling rates in our report represent the real recycling—versus collection—rate, meaning this rate is not what is collected for recycling, but rather what is available to be made into new products. Recycling rates in many states are still measured in terms of what is collected for recycling, so to enable a ‘like for like’ comparison between states, the collection rates have been adjusted to show the real recycling rate. Having a true assessment of recycling rates will better enable us to understand what policy and program measures are needed to capture more quality material, increasing circularity, reducing our need for virgin materials and thus helping protect the planet.
- Sarah Edwards, Director Eunomia North America
Smart policy decisions require an understanding of what's working when it comes to recycling in our country – and what’s not. And, with the state of Washington currently ranked 16th among all states for recycling packaging materials, we can do better. For example, the report showed that 89% of Washingtonians already have access to curbside recycling, yet only 25% of packaging is actually recycled, and only 13% of packaging is recycled in a closed loop. Passing legislation that leverages both EPR and Recycling Refunds, could increase beverage container recycling rates to over 90%. Together EPR and recycling refunds could deliver over $1 billion in environmental and economic returns to the state of Washington on an annual basis.
- Monica Stonier, Washington State Representative
New Belgium has long understood that the best container for our product is the one that truly gets recycled. This report makes it clear that smart policies like Extended Producer Responsibility and Recycling Refunds can both increase recycling rates, and help address climate change. With recycling rates remaining drastically low across many states, it is time to seize the opportunity of policy solutions that will deliver both high recycling rates, and quality material that can be recycled in a closed loop, in pursuit of a decarbonized and circular economy.
Katie Wallace, Chief ESG Officer